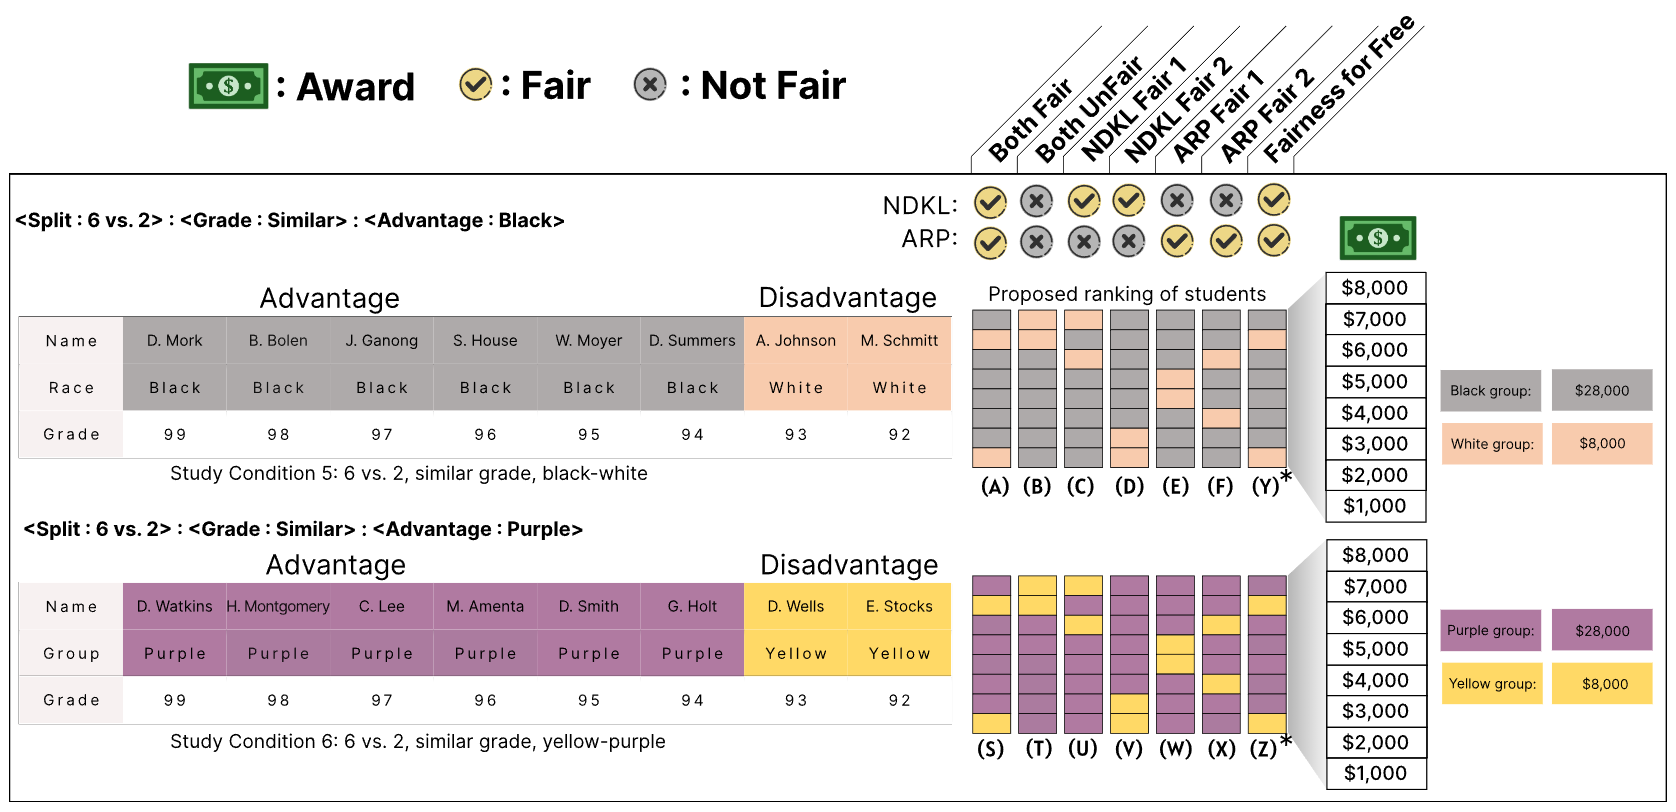
Publications

October 2023 | Workshop on Data Visualization for Social Good 2023
Noëlle Rakotondravony, Priya Dhawka, Melanie Bancilhon
October 2023 | IEEE Visualization and Visual Analytics (VIS)
Yuan Cui, Lily W. Ge, Yiren Ding, Fumeng Yang, Lane T. Harrison, Matthew Kay
October 2023 | IEEE Visualization and Visual Analytics (VIS)
Yiren Ding, Jack Wilburn, Hilson Shrestha, Akim Ndlovu, Kiran Gadhave, Carolina Nobre, Alexander Lex, Lane T. Harrison
October 2023 | IEEE Visualization and Visual Analytics (VIS) - Best Paper Honorable Mention
Yiren Ding, Lane T. Harrison
October 2023 | IEEE Visualization and Visual Analytics (VIS)
Akim Ndlovu, Hilson Shrestha, Lane T. Harrison
June 2023 | FAccT '23: the 2023 ACM Conference on Fairness, Accountability, and Transparency
Hilson Shrestha, Kathleen Cachel, Mallak Alkhathlan, Elke Rundensteiner, Lane T. Harrison
April 2023 | Proceedings of the 2023 CHI Conference on Human Factors in Computing Systems
Fumeng Yang, Yuxin Ma, Lane T. Harrison, James Tompkin, David H. Laidlaw
March 2023 | Companion Proceedings of the 28th International Conference on Intelligent User Interfaces
Akarsh Singh, Michael Wan, Lane T. Harrison, Anne Breggia, Robert Christman, Raimond L. Winslow, Saeed Amal
December 2022 | IEEE Visualization and Visual Analytics (VIS)
Russ Davis, Xiaoyin Pu, Yiren Ding, Brian Hall, Karen Bonilla, Mi Feng, Matthew Kay, Lane T. Harrison
November 2022 | Healthcare Analytics
ML Tlachac, Miranda Reisch, Brittany Lewis, Ricardo Flores, Lane T. Harrison, Elke Rundensteiner
October 2022 | IEEE Visualization and Visual Analytics (VIS)
Ryan Birchfield, Maddison Caten, Errica Cheng, Madyson Kelly, Truman Larson, Hoang Phan Pham, Yiren Ding, Noëlle Rakotondravony, Lane T. Harrison
Two charts showing results from two experiments. Left: Expression-to-Vis experiment. A user icon, an icon array with 100 gray icons, an arrow pointing to a second icon array with 67 icons in orange are above a graph that shows the 95% confidence interval of the values drawn on the icon arrays on the x-axis. The list of probability expressions is on the y-axis. Five 95% confidence intervals representing the range of drawn values in the five languages are displayed for each probability expression. Right: Vis-to-Expression experiment. A user icon, an icon array with 35 orange icons, and a list of probability expressions with the expression 'likely' highlighted are above a confidence interval graph that shows the value appearing on the icon array on the x-axis. The list of probability expressions is on the y-axis. Five 95% confidence intervals representing the range of drawn values in the five languages are displayed for each probability expression.
October 2022 | IEEE Visualization and Visual Analytics (VIS)
Noëlle Rakotondravony, Yiren Ding, Lane T. Harrison
October 2022 | IEEE Visualization and Visual Analytics (VIS)
Hilson Shrestha, Kathleen Cachel, Mallak Alkhathlan, Elke Rundensteiner, Lane T. Harrison