Abstract
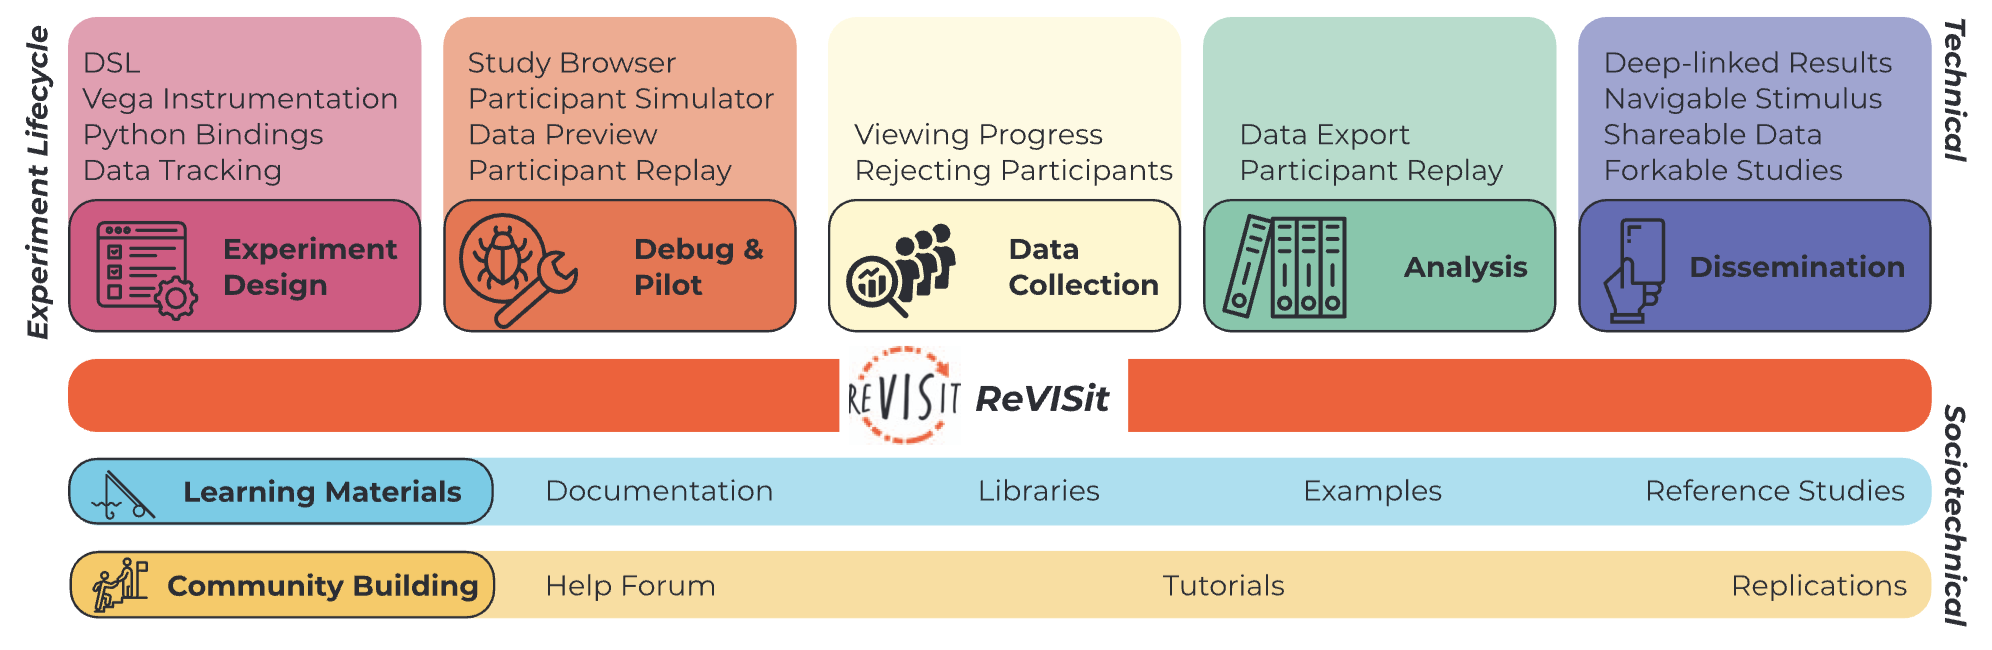
Online user studies of visualizations, visual encodings, and interaction techniques are ubiquitous in visualization research.Yet, designing, conducting, and analyzing studies effectively is still a major burden. Although various packages support such userstudies, most solutions address only facets of the experiment life cycle, make reproducibility difficult, or do not cater to nuanced studydesigns or interactions. We introduce reVISit 2, a software framework that supports visualization researchers at all stages of designingand conducting browser-based user studies. ReVISit supports researchers in the design, debug & pilot, data collection, analysis, anddissemination experiment phases by providing both technical affordances (such as replay of participant interactions) and sociotechnicalaids (such as a mindfully maintained community of support). It is a proven system that can be (and has been) used in publication-qualitystudies—which we demonstrate through a series of experimental replications. We reflect on the design of the system via interviewsand an analysis of its technical dimensions. Through this work, we seek to elevate the ease with which studies are conducted, improvethe reproducibility of studies within our community, and support the construction of advanced interactive studies.
BibTeX
@inproceedings{cutler2026revisit2,
author={Cutler, Zach and Wilburn, Jack and Shrestha, Hilson and Ding, Yiren and Bollen, Brian and Nadib, Khandaker Abrar and He, Tingying and McNutt, Andrew and Harrison, Lane and Lex, Alexander},
  journal={IEEE Transactions on Visualization and Computer Graphics},
  title={ReVISit 2: A Full Experiment Life Cycle User Study Framework},
  year={2026},
  volume={32},
  number={1},
  pages={13-23},
  keywords={Surveys;Reproducibility of results;Data visualization;Visualization;Libraries;Browsers;Videos;Software;Instruments;Graphical user interfaces;User studies;crowdsourcing;visualization experiments},
  doi={10.1109/TVCG.2025.3633896}
}