Abstract
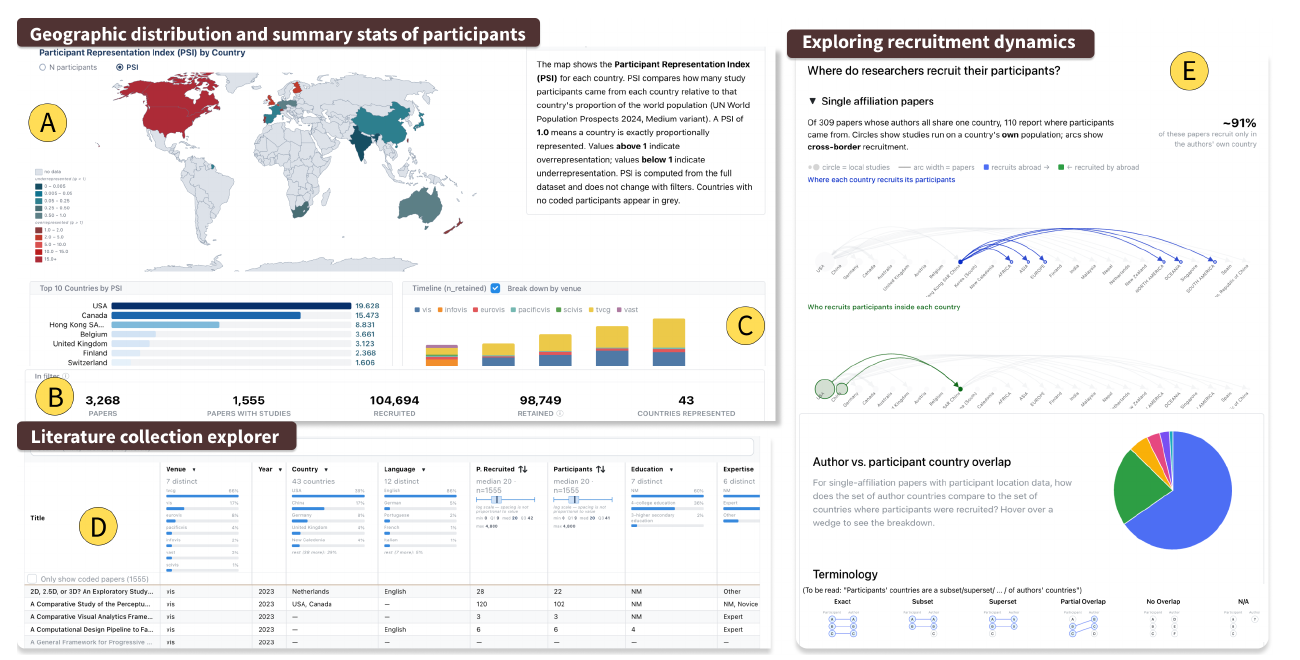
Study participants play a critical role in the advancement and validation of visualization research. However, we currently lack a collective understanding of who our study participants are, how they shape research findings, and who may be left out. To address this gap, we present Aına (eye-nah), a project that aims to contribute a dataset and an interactive interface for exploring the diversity of study participants in data visualization research published at VIS, EuroVis, PacificVis, and TVCG. The current data includes demographic and geographic details about participant samples and their involvement in studies, from 1555 visualization research papers. Our goal is to make this information accessible, understandable, and useful for the community from whom we seek feedback to better understand and develop the requirements towards this objective.
Explore the interface at aina.rakotondravony.com.